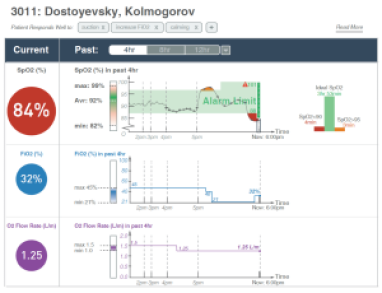
Hospitalized children on continuous oxygen monitors generate >40,000 data points per patient each day. These data do not show context or reveal trends over time, techniques proven to improve comprehension and use. Management of oxygen in hospitalized patients is suboptimal—premature infants spend >40% of each day outside of evidence-based oxygen saturation ranges and weaning oxygen is delayed in infants with bronchiolitis who are physiologically ready. Data visualizations may improve user knowledge of data trends and inform better decisions in managing supplemental oxygen delivery.
First, we studied the workflows and breakdowns for nurses and respiratory therapists (RTs) in the supplemental oxygen delivery of infants with respiratory disease. Secondly, using end-user design we developed a data display that informed decision-making in this context. Our ultimate goal is to improve the overall work process using a combination of visualization and machine learning.

