
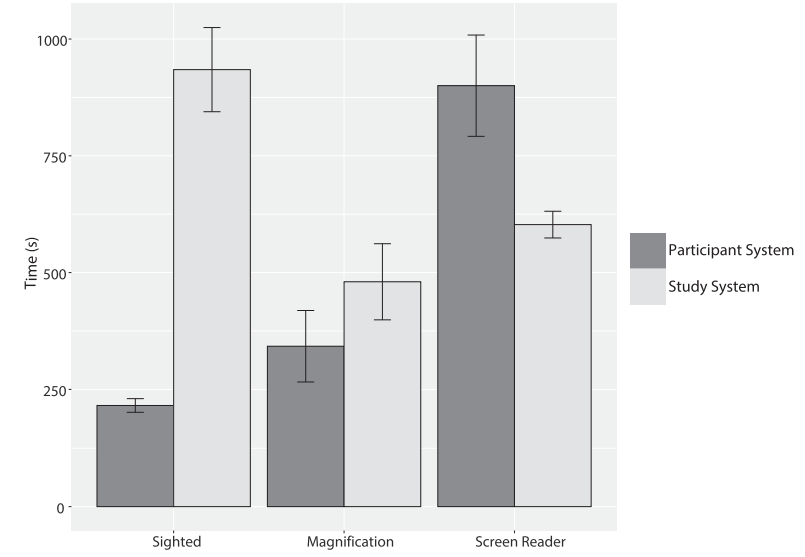
Average task completion time comparison between the participant system and experimental system
grouped by technology
Bar graph showing average task completion time comparison between the participant system and experimental system
grouped by technology. Screen reader participants are about 250 ms faster with the study system, while sighted participants and those using magnification are slower with the study system.