Knitting is a popular craft that can be used to create customized fabric objects such as household items, clothing and toys. Additionally, many knitters find knitting to be a relaxing and calming exercise. Little is known about how disabled knitters use and benefit from knitting, and what accessibility solutions and challenges they create and encounter. We conducted interviews with 16 experienced, disabled knitters and analyzed 20 threads from six forums that discussed accessible knitting to identify how and why disabled knitters knit, and what accessibility concerns remain. We additionally conducted an iterative design case study developing knitting tools for a knitter who found existing solutions insufficient. Our innovations improved the range of stitches she could produce. We conclude by arguing for the importance of improving tools for both pattern generation and modification as well as adaptations or modifications to existing tools such as looms to make it easier to track progress
Automatic knitting machines are robust, digital fabrication devices that enable rapid and reliable production of attractive, functional objects by combining stitches to produce unique physical properties. However, no existing design tools support optimization for desirable physical and aesthetic knitted properties. We present KnitGIST (Generative Instantiation Synthesis Toolkit for knitting), a program synthesis pipeline and library for generating hand- and machine-knitting patterns by intuitively mapping objectives to tactics for texture design. KnitGIST generates a machine-knittable program in a domain-specific programming language.
It was my honor this year to participate in an auto-ethnographic effort to explore accessibility research from a combination of personal and theoretical perspectives. In the process, and thanks to my amazing co-authors, I learned so much about myself, disability studies, ableism and accessibility.
Abstract: Accessibility research and disability studies are intertwined fields focused on, respectively, building a world more inclusive of people with disability and understanding and elevating the lived experiences of disabled people. Accessibility research tends to focus on creating technology related to impairment, while disability studies focuses on understanding disability and advocating against ableist systems. Our paper presents a reflexive analysis of the experiences of three accessibility researchers and one disability studies scholar. We focus on moments when our disability was misunderstood and causes such as expecting clearly defined impairments. We derive three themes: ableism in research, oversimplification of disability, and human relationships around disability. From these themes, we suggest paths toward more strongly integrating disability studies perspectives and disabled people into accessibility research.
Knitting creates complex, soft objects with unique and controllable texture properties that can be used to create interactive objects. However, little work addresses the challenges of using knitted textures. We present KnitPick: a pipeline for interpreting pre-existing hand-knitting texture patterns into a directed-graph representation of knittable structures (KnitGraphs) which can be output to machine and hand-knitting instructions. Using KnitPick, we contribute a measured and photographed data set of 300 knitted textures. Based on findings from this data set, we contribute two algorithms for manipulating KnitGraphs. KnitCarving shapes a graph while respecting a texture, and KnitPatching combines graphs with disparate textures while maintaining a consistent shape. Using these algorithms and textures in our data set we are able to create three Knitting based interactions: roll, tug, and slide. KnitPick is the first system to bridge the gap between hand- and machine-knitting when creating complex knitted textures.
KnitPick converts KnitSpeak into KnitGraphs which can be carved, patched and output to knitted results Data set measurement setup, including camera, scale, and stretching rigThe above images show a progression from the original Star texture to the same texture with 15 columns removed by texture carving. These photographs were shown to crowd-workers who rated their similarity. Even with a whole repetition width removed from the Stars, the pattern remains a recognizable star pattern.
A deeper understanding of how discrimination impacts psychological health and well-being of students would allow us to better protect individuals at risk and support those who encounter discrimination. While the link between discrimination and diminished psychological and physical well-being is well established, existing research largely focuses on chronic discrimination and long-term outcomes. A better understanding of the short-term behavioral correlates of discrimination events could help us to concretely quantify the experience, which in turn could support policy and intervention design. In this paper we specifically examine, for the first time, what behaviors change and in what ways in relation to discrimination. We use actively-reported and passively-measured markers of health and well-being in a sample of 209 first-year college students over the course of two academic quarters. We examine changes in indicators of psychological state in relation to reports of unfair treatment in terms of five categories of behaviors: physical activity, phone usage, social interaction, mobility, and sleep. We find that students who encounter unfair treatment become more physically active, interact more with their phone in the morning, make more calls in the evening, and spend less time in bed on the day of the event. Some of these patterns continue the next day.
Breakdown of 448 reports of unfair treatment by type. National, Orientation, and Learning refer to ancestry or national origin, sexual orientation, and learning disability respectively. See Table 3 for details of all categories. Participants were able to report multiple incidents of unfair treatment, possibly of different types, in each report. As described in the paper, we do not have data on unfair treatment based on race.A heatplot showing compliance with sensor data collection. Sensor data availability for each day of the study is shown in terms of the number of participants whose data is available on a given day. Weeks of the study are marked on the horizontal axis while different sensors appear on the vertical axis. Important calendar dates (e.g., start / end of the quarter and exam periods) are highlighted as are the weeks of daily surveys. The brighter the cells for a sensor the larger the number of people contributing data for that sensor. Event-based sensors (e.g., calls) are not as bright as sensors continuously sampled (e.g., location) as expected. There was a technical issue in the data collection application in the middle of study, visible as a dark vertical line around the beginning of April.Timeline and completion rate of pre, mid, and post questionnaires as well as EMA surveys. Y axis shows the completion rates and is narrowed to the range 50-100%. The completion rate of pre, mid, and post questionnaires are percentages of the original pool of 209 participants, whereas EMA completion rates are based on the 176 participants who completed the study. EMA completion rates are computed as the average completion rate of the surveys administered in a certain week of the study. School-related events (i.e., start and end of quarters as well as exam periods) are marked. Dark blue bars (Daily Survey) show the weeks when participants answered surveys every day, four times a dayPatterns of feature significance from the day before to two days after the discrimination event. The shortest bars represent the highest significance values (e.g., depressed and frustrated on day 0; depressed on day 1; morning screen use on day 2). There are no significant differences the day before. Most short-term relationships exist on the day of the event, a few appear on the next day (day 1). On the third day one significant difference, repeated, from the first day is observed.
Maker culture in health care is on the rise with the rapid adoption of consumer-grade fabrication technologies. However, little is known about the activity and resources involved in prototyping medical devices to improve patient care. In this paper, we characterize medical making based on a qualitative study of medical stakeholder engagement in physical prototyping (making) experiences. We examine perspectives from diverse stakeholders including clinicians, engineers, administrators, and medical researchers. Through 18 semi-structured interviews with medical-makers in US and Canada, we analyze making activity in medical settings. We find that medical-makers share strategies to address risks, define labor roles, and acquire resources by adapting traditional structures or creating new infrastructures. Our findings outline how medical-makers mitigate risks for patient safety, collaborate with local and global stakeholder networks, and overcome constraints of co-location and material practices. We recommend a clinician-aided software system, partially-open repositories, and a collaborative skill-share social network to extend their strategies in support of medical making.
Design in the Public Square: Supporting Cooperative Assistive Technology Design Through Public Mixed-Ability Collaboration (CSCW 2019)
Mark. S. Baldwin, Sen H Hirano, Jennifer Mankoff, Gillian Hayes
From the white cane to the smartphone, technology has been an effective tool for broadening blind and low vision participation in a sighted world. In the face of this increased participation, individuals with visual impairments remain on the periphery of most sight-first activities. In this paper, we describe a multi-month public-facing co-design engagement with an organization that supports blind and low vision outrigger paddling. Using a mixed-ability design team, we developed an inexpensive cooperative outrigger paddling system, called DEVICE, that shares control between sighted and visually impaired paddlers. The results suggest that public design, a DIY (do-it-yourself) stance, and attentiveness to shared physical experiences, represent key strategies for creating assistive technologies that support shared experiences.
A close-up of version three of the CoOP system mounted to the rudder assembly and the transmitter used to control the rudder (right corner).The design evolution of the CoOP system in order of iteration from left to right.
How can physical computing enable new solutions to accessibility, including both access to the world and access to computers? Similarly, how can a disability studies perspective guide us in developing empowering and relevant solutions to accessibility problems? This course explores both of those questions through a combination of discussions, reading, and building.
Access technology (AT) has the potential to increase autonomy, and improve millions of people’s ability to live independently. This potential is currently under-realized because the expertise needed to create the right AT is in short supply and the custom nature of AT makes it difficult to deliver inexpensively. Yet computers’ flexibility and exponentially increasing power have revolutionized and democratized access technologies. In addition, by studying access technology, we can gain valuable insights into the future of all user interface technology.
In this course we will focus on two primary domains for access technologies: Access to the world (first half of the class) and Access to computers (second half of class). Students will start the course by learning some basic physical computing capabilities so that they have the tools to build novel access technologies. We will focus on creating AT using sensors and actuators that can be controlled/sensed with a mobile device. The largest project in the class will be an open ended opportunity to explore access technology in more depth.
Assistive Technologies for Students with Visual Impairments and Blindness (On Canvas). Really interesting contrast to the other; but long — skim it, and focus on learning about at least 5 assistive technologies you weren’t familiar with before (starts on p. 11 of the pdf and goes until p. 31) p. 33 is also worth reading.
Week 8 (11/13 ONLY): Applications
Discuss some application areas for accessible technology
Exercise & Recreation
Navigation & Maps
Programming and Computation
Home/IoT control
Reflection on role of User Research in Successful AT
Reading 2: Exploring Aesthetic Enhancement of Wearable Technologies for Deaf Women .
Week 9 (11/18; 11/20): The Web
Learn about “The Web,” how access technologies interact with the Web, and how to make accessible web pages.
WebAim.org — WebAIM has long been a leader in providing information and tutorials on making the Web accessible. A great source where you can read about accessibility issues, making content accessible, etc. Run it on your website or web page and look at the results before class.
Reading 1: Google Video on Practical Web Accessibility — this video provides a great overview of the Web and how to make web content accessible. Highly recommended as a supplement to what we will cover in class.
Optional Reading: If you want to supplement the reading with written guidance, check out WebAim.org Introduction to Web Accessibility, specifically the section titled ‘Principles of Accessible Design’ (which has links to how to properly write alt text; appropriate document structure, and so on).
Wireless Analytics for 3D Printed Objects: Vikram Iyer, Justin Chan, Ian Culhane, Jennifer Mankoff, Shyam Gollakota UIST, Oct. 2018 [PDF]
We created a wireless physical analytics system works with commonly available conductive plastic filaments. Our design can enable various data capture and wireless physical analytics capabilities for 3D printed objects, without the need for electronics.
We make three key contributions:
(1) We demonstrate room scale backscatter communication and sensing using conductive plastic filaments.
(2) We introduce the first backscatter designs that detect a variety of bi-directional motions and support linear and rotational movements. An example is shown below
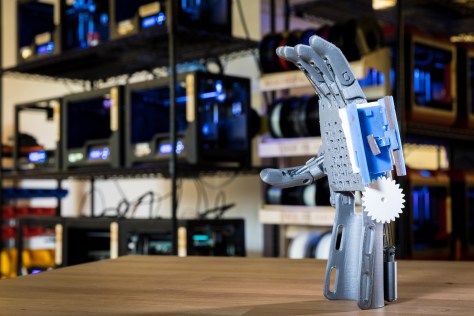
(3) As shown in the image below, we enable data capture and storage for later retrieval when outside the range of the wireless coverage, using a ratchet and gear system.
We validate our approach by wirelessly detecting the opening and closing of a pill bottle, capturing the joint angles of a 3D printed e-NABLE prosthetic hand, and an insulin pen that can store information to track its use outside the range of a wireless receiver.
The absence of tactile cues such as keys and buttons makes touchscreens difficult to navigate for people with visual impairments. Increasing tactile feedback and tangible interaction on touchscreens can improve their accessibility. However, prior solutions have either required hardware customization or provided limited functionality with static overlays. In addition, the investigation of tactile solutions for large touchscreens may not address the challenges on mobile devices. We therefore present Interactiles, a low-cost, portable, and unpowered system that enhances tactile interaction on Android touchscreen phones. Interactiles consists of 3D-printed hardware interfaces and software that maps interaction with that hardware to manipulation of a mobile app. The system is compatible with the built-in screen reader without requiring modification of existing mobile apps. We describe the design and implementation of Interactiles, and we evaluate its improvement in task performance and the user experience it enables with people who are blind or have low vision.
XiaoyiZhang, TracyTran, YuqianSun, IanCulhane, ShobhitJain, JamesFogarty, JenniferMankoff:Interactiles: 3D Printed Tactile Interfaces to Enhance Mobile Touchscreen Accessibility. ASSETS 2018: To Appear[PDF]
Figure 2. Floating windows created for number pad (left), scrollbar (right) and control button (right bottom). The windows can be transparent; we use colors for demonstration.
Figure 4. Average task completion times of all tasks in the study.


 The absence of tactile cues such as keys and buttons makes touchscreens difficult to navigate for people with visual impairments. Increasing tactile feedback and tangible interaction on touchscreens can improve their accessibility. However, prior solutions have either required hardware customization or provided limited functionality with static overlays. In addition, the investigation of tactile solutions for large touchscreens may not address the challenges on mobile devices. We therefore present Interactiles, a low-cost, portable, and unpowered system that enhances tactile interaction on Android touchscreen phones. Interactiles consists of 3D-printed hardware interfaces and software that maps interaction with that hardware to manipulation of a mobile app. The system is compatible with the built-in screen reader without requiring modification of existing mobile apps. We describe the design and implementation of Interactiles, and we evaluate its improvement in task performance and the user experience it enables with people who are blind or have low vision.
